
Gmail's filters blocked nearly 15 billion unwanted emails every day while keeping more than 99.9% of spam, phishing, and malware out of inboxes, Google reported in October 2023 in its published account of Gmail's spam defenses. Spam risk numbers exist because of that filtering, and each one measures a different slice of it. One number is a complaint rate. Another is a placement rate. A third is a binary blocklist hit. Teams get into trouble when they read all three as a single score, then cut volume for the wrong reason. The fix is mechanical: name the denominator, name the provider, then check the limit that applies before acting.
The Spam Risk Numbers Mailbox Providers Track
A spam risk number is a ratio, usually complaints or spam placements divided by delivered mail, calculated by a mailbox provider or a monitoring tool over a rolling window. The denominator changes from one provider to the next, so the same complaint count can look harmless in one dashboard and dangerous in another. Find the provider that delivers most of your mail, read that provider's number in the table below, then check the limit attached to it before changing anything.
| Metric | Where to read it | Threshold | What it tells you |
|---|---|---|---|
| Gmail user-reported spam rate | Google Postmaster Tools | Keep below 0.1%, never reach 0.3% | Complaints per Gmail-delivered message, updated daily |
| Yahoo complaint rate | Yahoo Complaint Feedback Loop | Stay below 0.3% of inbox-delivered mail | Complaints divided by messages delivered to the inbox |
| Outlook.com junk complaint rate | Microsoft feedback loop | No fixed public ceiling, so set a baseline from your own trend | Junk complaints per delivered message, trended by domain and IP |
| Inbox placement rate | Inbox placement tests | Set your own baseline | Share of test messages landing in inbox versus spam |
| Hard bounce rate | Your sending platform reports | No published provider limit | Share of addresses that permanently reject your mail |
| DNS blocklist listing | Blocklist checker | Any listing needs review | Whether your sending IP or domain appears on at least one list |
Three rows are provider-published ratios, two are ratios you build from your own tests, and one is a binary state. Complaint rates divide by delivered messages. Placement rates divide by the test messages you send. A blocklist listing divides by nothing at all. It's yes or no, and a yes needs a review of which IP or domain triggered it, on which list, and whether the providers your recipients use consult that list.
Pick one number to act on, not six. If a complaint rate is above its warning level, that's the one, because complaints move reputation faster than anything else on the list. If complaints look fine but placement tests show spam-folder delivery, the problem sits upstream of complaints: authentication, blocklist status, or content. Chasing every metric at once makes it impossible to know which change worked.
Practical rule: compare each number only with the limit set by the provider that produced it.
Microsoft publishes the factors behind Outlook.com filtering rather than a complaint ceiling, which makes its row the one readers often misread. They borrow Gmail's ceiling and assume it transfers. It doesn't.
How to Calculate Your Complaint Rate Correctly
Thirty complaints can produce a 0.3% rate or a 0.03% rate from the same campaign, and only one of those figures is the one a provider measures. A complaint rate is a ratio, and each provider defines both sides of it: which events count as complaints in the numerator, and which messages count in the denominator. Yahoo asks bulk senders to keep the complaint rate below 0.3%, calculated on messages delivered to the inbox rather than total messages sent, and tracks it through its Complaint Feedback Loop (Yahoo sender best practices). The math is simple once the denominator is right.
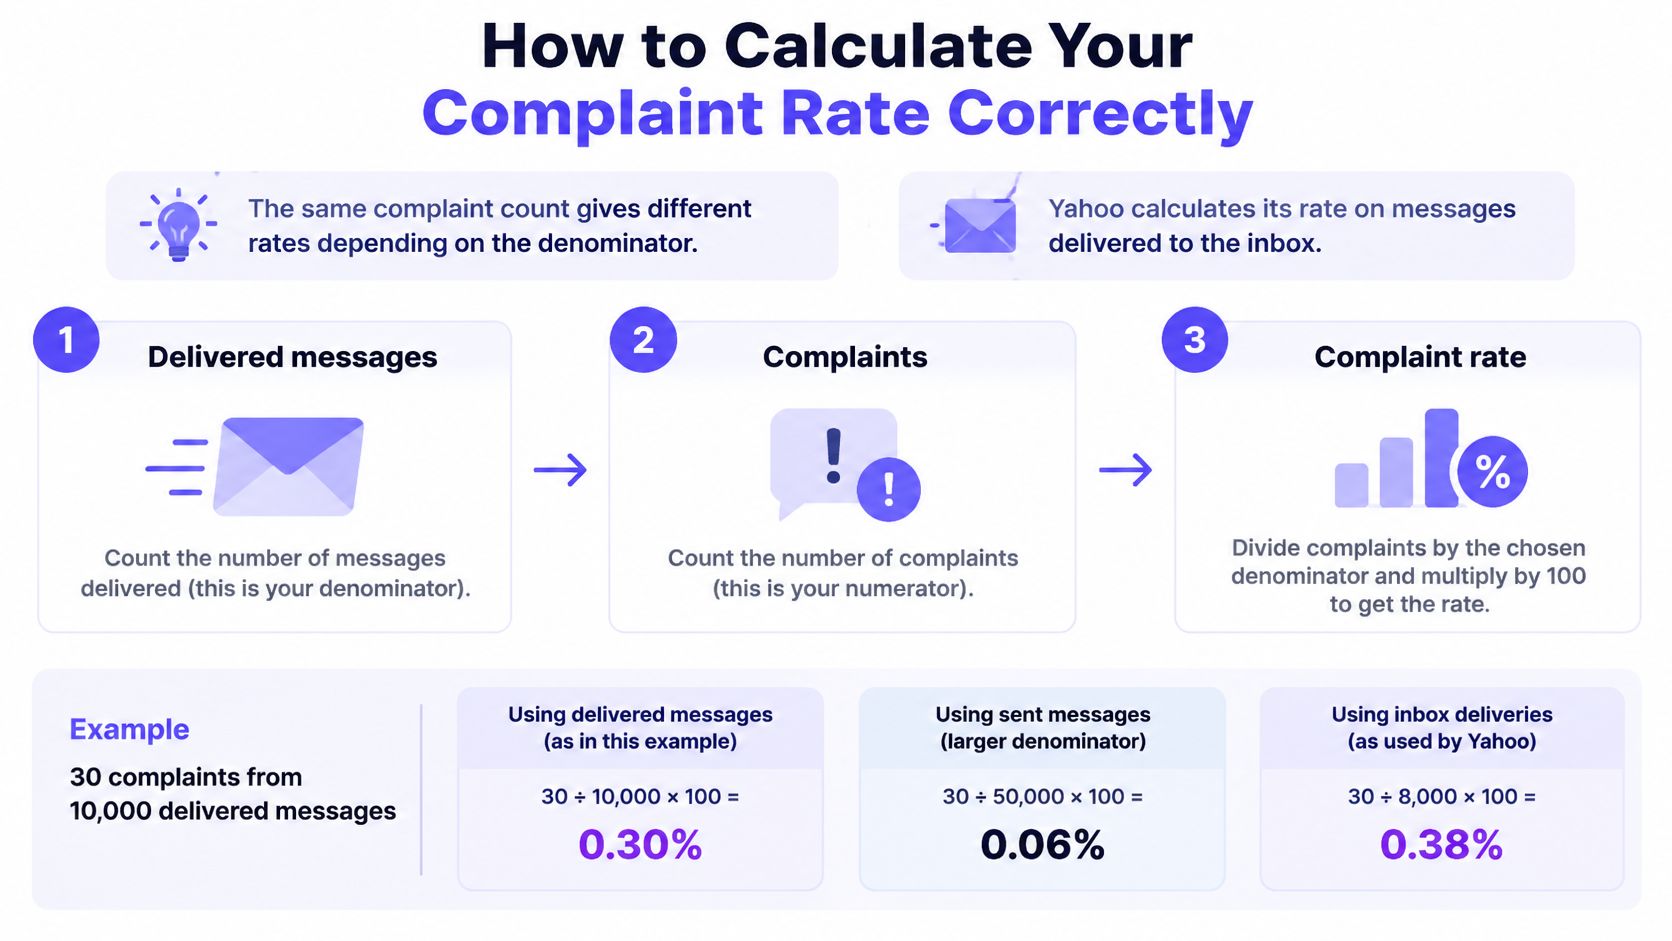
The infographic above shows how one complaint count produces different rates as the denominator shifts. The sequence below builds each side of the ratio before dividing, so the result is a number you can defend.
- Pull complaints for one provider and one day. Use that provider's feedback loop, since a blended total from your sending platform mixes providers that define a complaint differently.
- Pull inbox-delivered messages for the same provider and day. Rejected and deferred mail never reached a recipient and cannot produce a complaint, so attempted sends stay out of the denominator.
- Divide complaints by delivered messages. Straight division, no weighting.
- Multiply by 100. That produces the percentage a provider compares against its limit.
- Compare the result with that provider's own threshold. Yahoo's ceiling and Gmail's warning line are different numbers applied to different populations.
- Repeat the calculation daily. A single day tells you nothing. A run of daily readings shows whether last week's cleanup moved the rate.
Worked example with a real denominator
A campaign attempts 100,000 sends to Yahoo addresses. The provider rejects or defers 90,000 and delivers 10,000 to inboxes. Thirty recipients report spam.
Divide by attempted sends and you get 30 over 100,000, a 0.03% rate that reads like a model program. Divide by inbox-delivered messages and you get 30 over 10,000, a 0.3% rate sitting exactly at Yahoo's ceiling. Nothing about the campaign changed. Only the denominator did, and the second figure is the one Yahoo acts on.
Gmail runs the same arithmetic against a stricter line. Ten complaints among 10,000 Gmail-delivered messages is 0.1%, and 30 complaints in that same population is 0.3%, so the distance between a healthy rate and an enforcement boundary is 20 complaints at that scale, per Google's Gmail sender guidelines.
The thresholds are public; your complaint count is not. Only the provider's feedback loop reports how many recipients pressed the spam button. Reading the rate correctly is half the job. Knowing what placement looks like beyond the report your own platform returns is the other half, and fixing inbox visibility with The Social Search covers why reported delivery and real placement drift apart.
What a healthy result looks like
A working rate stays flat or falls after a list cleanup and holds through the next send. A rate that climbs two mornings running after you added a segment is a signal to cut that segment's volume before the higher readings feed back into reputation. Monthly averages bury both patterns, which is why the arithmetic above runs daily rather than at report time.
A complaint rate only means something attached to its provider and its denominator. Report it that way, as a labeled ratio, and the number can finally be compared against the right limit.
Why Outlook Reads Complaints Differently
Outlook gives senders no complaint-rate ceiling to calibrate against. Where other providers publish fixed thresholds, Microsoft's Outlook.com sender support names junk-email complaint rate as one of several factors that lower sender reputation and deliverability, alongside sending IP, domain, authentication, list accuracy, and message content. One blended spam rate hides the provider that's failing, and with Outlook the same complaint count can land differently depending on who you are and who you mail.
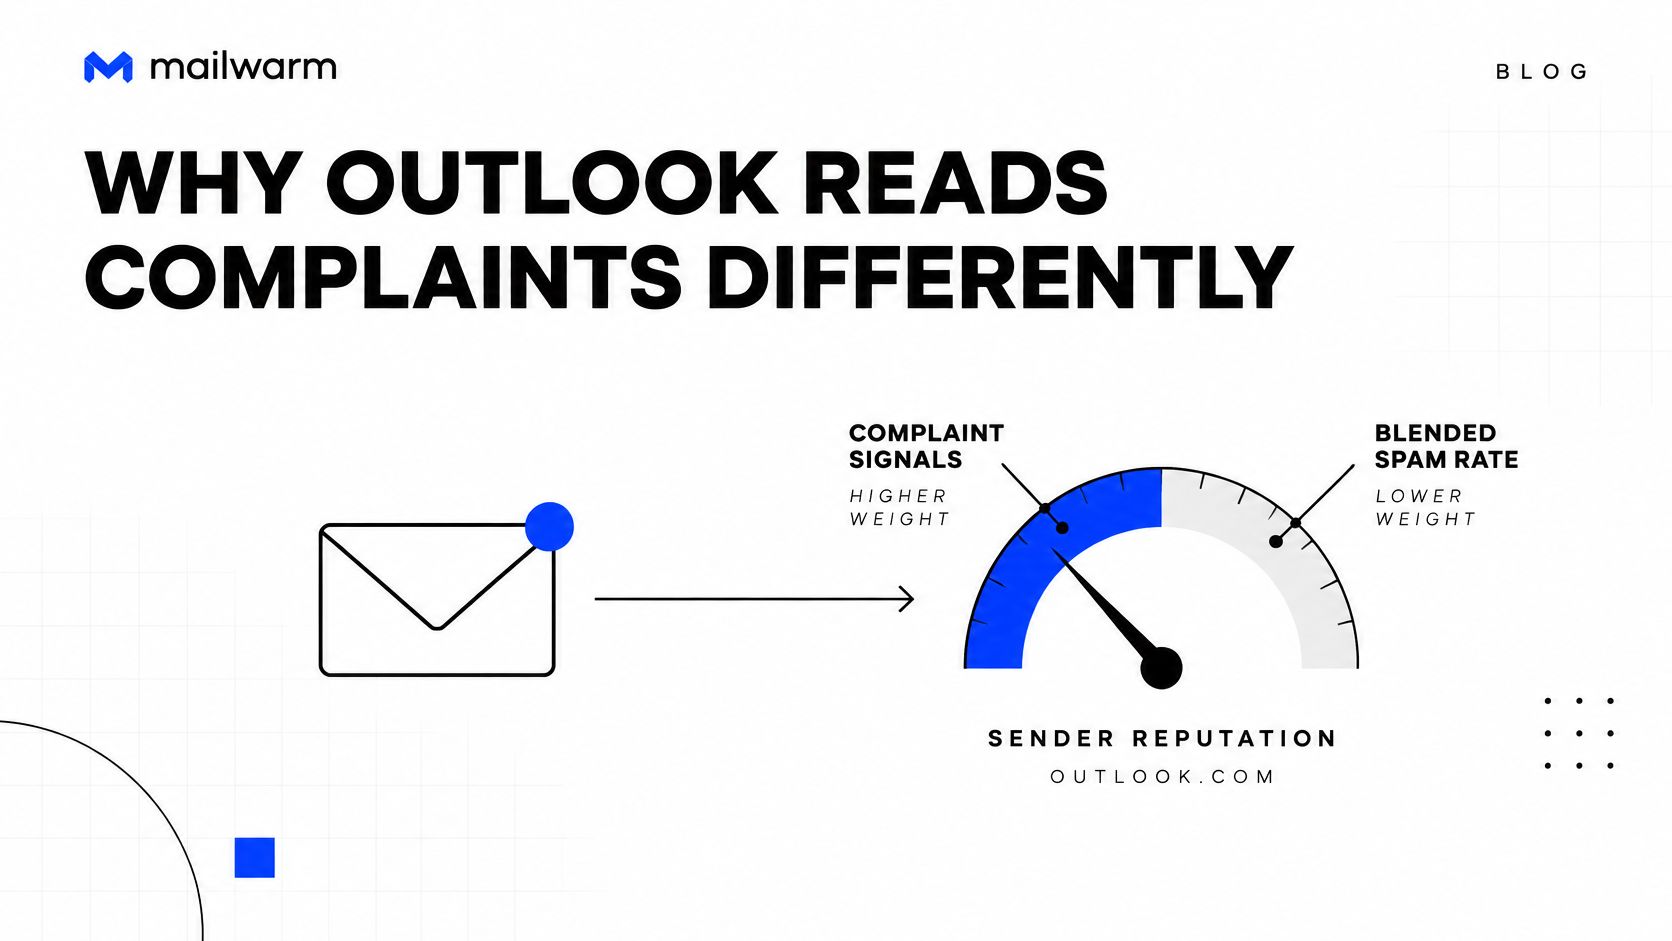
The diagram shows those signals combining into a reputation judgment rather than a single score. That has a practical consequence: without a published number, you can't watch one percentage and assume you're safe. A complaint count that looks trivial in absolute terms still weighs against reputation when it repeats across consecutive sends, because Microsoft evaluates the pattern rather than a single threshold crossing.
Give Outlook its own line in the tracking sheet, split by domain, sending IP, mailbox, and campaign. One Outlook row averaged across five campaigns will hide the campaign causing the trouble.
A clean Gmail rate tells you nothing about Outlook placement. Different provider, different signals, different recipients.
Authentication doesn't offset poor targeting, since Microsoft lists list accuracy and content among the factors that affect filtering. A fully authenticated domain still lands in junk when the addresses were never engaged. When Outlook complaints rise while Gmail stays flat, the usual cause is one list segment or one campaign. Suppress its complainers, cut its volume, and leave the rest of the program alone. SNDS data for cold outreach shows which reports Microsoft exposes and how to read them.
Authentication and Blocklist Numbers That Signal Risk
Complaint rates measure what recipients did. Authentication results and blocklist status measure whether a provider can verify who is sending. When placement drops with no matching rise in complaints, these are the numbers that usually explain it.
Many of the domains sending mail today publish DMARC records set to p=none. Read that share for what it is: a denominator of published records covering legitimate senders and bulk spammers alike. The figure describes policy posture. Placement outcome is a separate measurement.
What p=none does is leave a door open. The policy asks receiving providers to send reports about mail using your domain while letting that mail through. Those aggregate reports are the useful part, because they list every server and service sending as your domain. Fix the unknown sources first, then tighten the policy.
Each signal here has its own denominator. SPF and DKIM results are binary and apply to a single message. A blocklist entry is a state attached to an IP or domain, and its weight depends on whether the providers your recipients use query that list. Folding all of it into one health score hides which signal moved.
Four checks in order
- SPF. Confirm the record lists every service that sends on your behalf, including the CRM, the support desk, and the billing system. A missing sender is a fail waiting for the first invoice run.
- DKIM. Confirm outgoing mail is signed. A published key with a broken signer can look identical to no signing at all in some reports.
- DMARC. Move from p=none to quarantine or reject once the reports come back clean, and check the record with the DMARC checker before and after the change.
- Blocklists. Any listing needs a review of which IP or domain is listed, when it appeared, and who queries that list. A listing is a reason to trace the source; severity depends on the providers reading it.
Run the checks in that order every time. SPF and DKIM failures leave DMARC reports with no authenticated identity to work from, and a blocklist lookup taken before authentication is fixed usually surfaces the symptom while the cause stays hidden.
Monitoring Thresholds and When to Pause Sending
Gmail measures its user-reported spam rate daily and sets two thresholds that change what a sender is allowed to do. Keeping the rate below 0.1% protects inbox delivery. Reaching 0.3% or higher has a substantially stronger negative effect, and since June 2024, bulk senders above 0.3% aren't eligible for mitigation. Eligibility returns only after seven consecutive days below 0.3%, per Google's bulk sender spam rate guidance. The daily cadence is the part teams underestimate. A monthly average can sit comfortably low while three consecutive days sit above the warning line.
| Gmail spam rate | Action | Why it matters |
|---|---|---|
| Below 0.1% | Keep the current plan and log the rate | Under the warning level |
| 0.1% to below 0.3% | Cut volume and audit the latest list | Rates above 0.1% can hurt inbox delivery |
| 0.3% or higher | Pause the affected segment and investigate by campaign, domain, and sending identity | Above the ceiling, so mitigation isn't available |
The gap between 0.1% and 0.3% is where most recoverable problems live. It's wide enough to fix a list and narrow enough that daily reading beats monthly reporting.
What the seven-day rule doesn't cover
The seven days govern Gmail's mitigation eligibility. They don't certify that your list is fixed or that a paused segment is safe to resume. Restart in steps and keep reading the rate every morning for the first week.
Resume at a fraction of the old volume, not at the volume that caused the spike.
A cadence the team can keep
- Daily during active campaigns: read the spam rate for your largest provider and log any threshold crossing with its suspected cause.
- Weekly: run placement tests across Gmail, Outlook, and Yahoo, because a provider can drift while your blended number holds steady.
- Per incident: record the campaign, domain, and sending identity involved, so a repeat pattern is visible rather than remembered.
- Alongside Gmail: review Yahoo complaints on the same rhythm, since its ceiling applies to a different denominator.
Matching a rise to its cause is the hard part. Mailwarm's monitoring shows inbox placement and spam score side by side with warmup activity, so a jump in the number can be lined up against the segment, domain, or content change that produced it.
How to Lower Spam Risk Numbers in 30 Days
Thirty days is enough to move a spam risk number if you change the inputs in the right order and resist adding volume in week two.
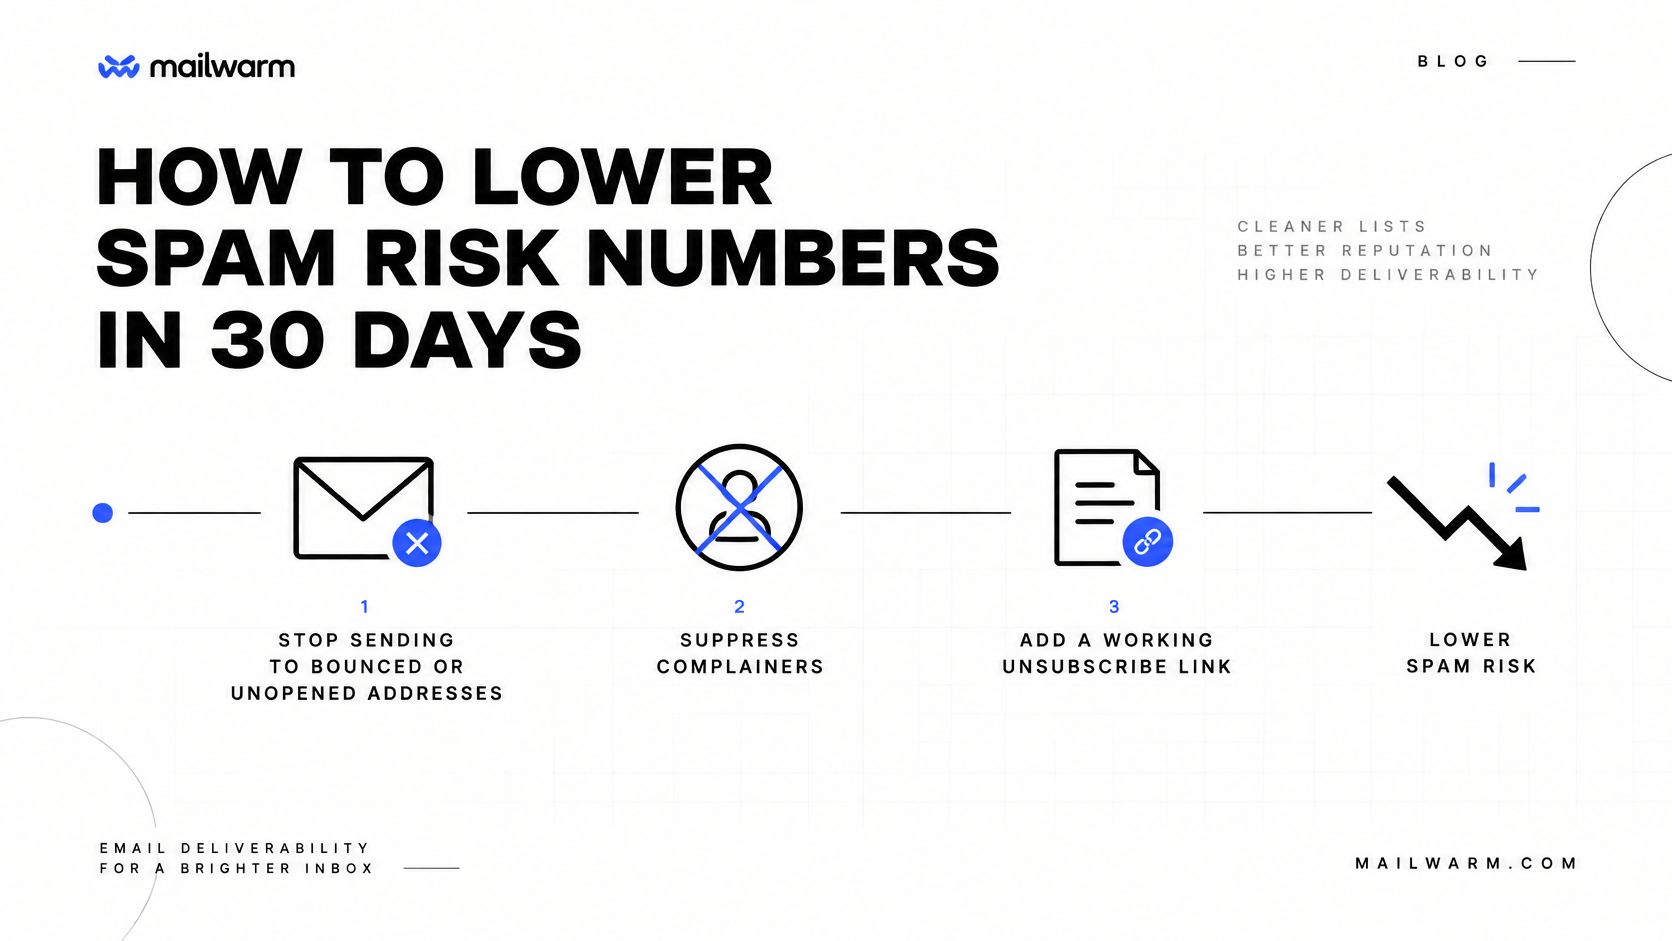
- Cut the dead weight first. Stop sending to addresses that hard-bounced or never opened in the last 90 days. Complaint rates are ratios, and unengaged recipients are the cheapest denominator problem to solve.
- Suppress every complainer permanently. Re-mailing someone who reported you is the fastest way to compound a rate that was already too high.
- Fix the unsubscribe path. The US CAN-SPAM Act requires an opt-out that keeps working for at least 30 days after each send, and requests must be honored within 10 business days. The process can't require a fee, extra personal data beyond an email address, or more than a reply or a single web page, per the FTC's CAN-SPAM compliance guide. Each separate violating email can carry a civil penalty of up to $53,088.
- Hold volume where complaints stay under 0.1%. Not where the revenue plan says it should be. The rate sets the ceiling, and the ceiling wins.
- Repair authentication before raising volume. Tightening DNS after you scale means the new volume arrives carrying the old problems.
- Increase in steps and check daily. Run the spam word checker over the next subject line and body before the send, not after the complaints arrive.
A recovery case, with its caveats
One sender in the Mailwarm network went from 75.6% of emails landing in spam to 11% over 14 weeks, while volume grew from 250 emails to 4,264. Spam rate here means the share of that sender's emails that landed in spam, first test against the last four weeks.
That's a strong case, not an average. The sender changed several things at once, so no single step above gets the credit, and a team that only fixes its unsubscribe link shouldn't expect the same curve.
A flat or falling rate matters more than a fast one. Rates that drop in a week and rebound in three usually mean volume was cut, not that the list was repaired.
Check Your Spam Risk Numbers This Week
Four steps, once a week, and you'll know which problem you have.
- Open the dashboard for your largest provider. Note the complaint rate for the last seven days rather than the month.
- Recalculate it with delivered messages as the denominator. Use the sequence from the complaint-rate section, and check whether the number moves.
- Run the four identity checks. SPF, DKIM, DMARC, and a blocklist lookup on the sending IP and domain, in that order.
- Send a sample and watch where it lands. Then run a quick deliverability test to see inbox versus spam placement. Mailwarm's test sends one email, returns a score out of 100, and ranks the fixes by likely impact.
Now the first decision. If the rate sits under 0.1% and authentication passes, keep the current plan and put a weekly review in the calendar. Between 0.1% and 0.3%, cut volume and clean the list before anything else. At 0.3%, pause the affected segment and investigate by campaign, domain, and sending identity. If email is part of your growth strategy, Mailwarm helps you build sender reputation, monitor inbox placement, and reduce spam risk with expert-guided warmup.
Frequently Asked Questions About Spam Risk Numbers
What is a spam risk number?
It's a ratio, usually complaints or spam placements divided by delivered mail, that a provider or monitoring tool calculates over time. Each number has its own denominator and its own limit, so compare each one only with the provider that produced it.
What is the Gmail spam rate threshold?
Keep Gmail's user-reported spam rate below 0.1%, and never let it reach 0.3%. Above 0.3%, bulk senders aren't eligible for mitigation until they stay below 0.3% for seven consecutive days.
Why do emails go to spam?
Mailbox providers score sender identity, authentication, complaint rates, list quality, and content together. A message can be technically accepted and still land in spam when those signals are weak, which is why a clean subject line alone rarely fixes placement.
How does Mailwarm help improve sender reputation?
Mailwarm helps improve sender reputation and reduce spam risk through real inbox engagement and deliverability insights. It's a premium email warmup and deliverability platform that also offers spam score monitoring and inbox placement insights alongside provider-level warmup.
Does Mailwarm need access to my inbox?
No. Unlike basic warmup tools, Mailwarm doesn't require IMAP access or permission to read your private inbox, so warmup runs without exposing your live mail.
A complaint rate, a placement rate, and a blocklist listing each answer a different question, and Mailwarm's deliverability team reads them that way: separately, with the denominator named. If the numbers in this article describe your last campaign and you want the next one to land differently, Mailwarm combines real inbox engagement, spam score monitoring, inbox placement insights, and expert deliverability calls so the fix follows the diagnosis instead of guessing at it. Every plan includes access to the 50,000+ real inbox network and a deliverability review of your sending setup.