

Inbox placement rate is the percentage of emails that land in the recipient's main inbox, not the spam or promotions folder. The global average inbox placement rate fell below 85% in 2022, which means more than 15 out of every 100 emails sent were filtered into spam or junk folders, according to Validity's 2023 Email Deliverability Benchmark Report.
That number changes how email performance should be judged. A campaign can look fine in a sending dashboard and still miss the place where people make decisions.
For founders, sales teams, agencies, recruiters, and marketers, that's the difference between “sent” and “seen.” It's also why inbox placement rate matters more than surface metrics when email is tied to pipeline, bookings, hiring, or retention.
What Is Inbox Placement Rate and Why It Matters Now
Inbox placement rate is the percentage of emails that reach the recipient's primary inbox. It doesn't count server acceptance alone, and it doesn't treat the Promotions tab as equal to the main inbox.

Why this metric matters more than delivery
Many teams still look at “delivered” as if it means “visible.” It doesn't.
According to Validity's 2023 Email Deliverability Benchmark Report, the global average inbox placement rate fell below 85% in 2022, meaning more than 15 out of every 100 emails sent were filtered into spam or junk folders. That's a major loss before the recipient even decides whether to open or reply.
A business can write strong copy, target the right people, and still underperform if mailbox providers don't trust the sender. That's why inbox placement rate is closer to a truth metric than open rate or raw delivery rate.
Practical rule: If email is a growth channel, the real question isn't “Did the server accept it?” It's “Did a human see it in the main inbox?”
Why business owners should care now
Mailbox providers have become stricter. They weigh trust, technical setup, recipient behavior, and complaint risk more heavily than many teams expect.
That creates a real business problem. Cold outreach gets buried. Product emails lose visibility. Recruitment outreach misses candidates. Marketing campaigns look weaker than they really are.
For teams improving outbound systems, list quality, and targeting, it also helps to pair deliverability work with broader valuable lead generation insights so better inbox placement translates into better pipeline, not just better diagnostics.
Delivery vs Deliverability vs Inbox Placement
These three terms get mixed together all the time. That confusion leads to bad decisions.
A simple way to think about it is physical mail. Delivery means the building accepted the package. Deliverability means it wasn't rejected at the door. Inbox placement means it arrived at the recipient's desk instead of getting tossed into a side room.
What each metric really measures
Technically, Data Innovation explains that delivery rate confirms an email was accepted by the receiving server, while inbox placement rate measures what percentage of those delivered emails successfully bypass spam filters to reach the primary inbox, a metric that directly correlates with opens and conversions.
That difference matters because accepted mail can still disappear into spam, junk, or secondary tabs. A “healthy” delivery rate can hide a weak campaign if placement is poor.
| Metric | What It Measures | Good Benchmark |
|---|---|---|
| Delivery rate | Whether the receiving server accepted the email | Often judged by whether mail is consistently accepted, but this alone doesn't confirm visibility |
| Deliverability | Whether emails avoid outright rejection and broadly reach recipient systems | Strong when authentication, reputation, and list quality keep rejection and filtering low |
| Inbox placement | Whether messages land in the primary inbox where people are likely to see them | A strong inbox placement rate is above 85% in the primary inbox with less than 5% landing in spam, according to Data Innovation's benchmark guide |
Why teams optimize the wrong thing
A lot of tools report what's easiest to measure, not what matters most. Server acceptance is easy. Primary inbox visibility is harder.
That's why teams can feel confident while performance slips. If a sending platform says messages were delivered, it sounds like success. But the recipient may never see them.
Three common mistakes show up here:
Chasing acceptance only: Teams celebrate a high delivery rate while ignoring placement by provider.
Ignoring authentication gaps: Broken alignment can let mail through but still weaken trust signals. A practical primer on this sits in Mailwarm's guide to mastering email authentication.
Treating all inbox folders the same: Primary, Promotions, and spam don't drive the same business outcome.
Delivery is a transport metric. Inbox placement is an attention metric.
What Is a Good Inbox Placement Rate by Provider
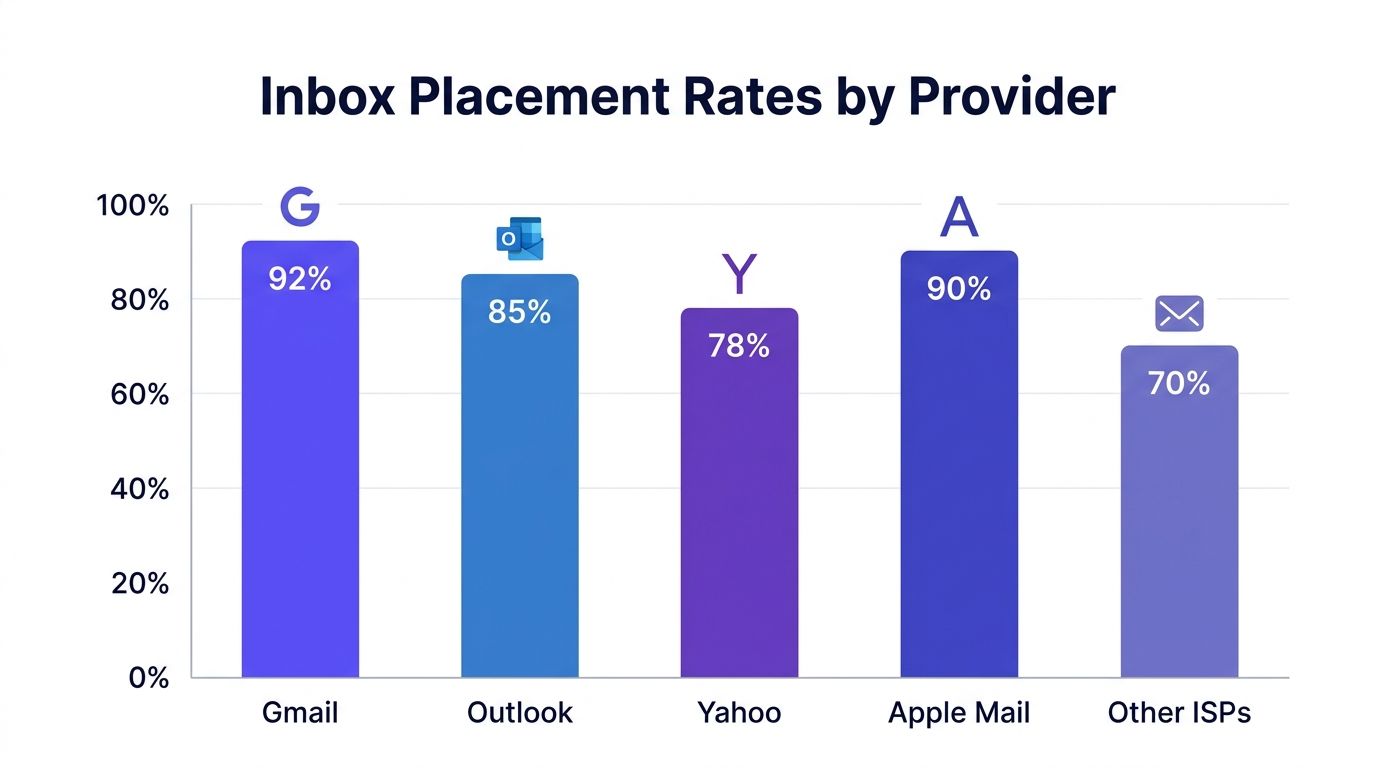
Provider averages tell a harder story than account-level dashboards. The same sender can perform well at one mailbox provider and badly at another.
Why overall averages hide the real problem
Provider-level data shows how misleading blended reporting can be. According to Mailmend's provider breakdown, Gmail may show a 95.54% deliverability rate, yet only 57.8% of messages land in the primary inbox. Consumer Microsoft accounts are even tougher, with inbox placement at 26.77%.
That gap changes how senders should evaluate performance. A campaign can look stable in aggregate while one major provider suppresses most of the traffic.
What counts as strong and weak placement
Benchmarks are useful, but only if they're interpreted correctly.
According to OIMetrics, a healthy inbox placement rate benchmark for strong email programs is 95% or higher, with delivery rates typically around 98–99% and spam complaint rates below 0.1%. Separately, Data Innovation defines a strong inbox placement rate as exceeding 85% in the primary inbox, with less than 5% landing in spam, while rates below 70% indicate poor sender reputation requiring immediate remediation.
Those two views are useful together. One sets a high operating target. The other gives a practical threshold for diagnosing trouble.
Why provider-level monitoring matters
A sender shouldn't ask, “What's the inbox placement rate?” The better question is, “What's the inbox placement rate at Gmail, Outlook, Microsoft 365, Yahoo, and the providers that matter most to this audience?”
That's especially important in B2B. A team selling into Microsoft-heavy organizations can't rely on blended averages if Outlook-family placement is weak.
A practical review should include:
Provider splits: Separate Gmail from Microsoft traffic.
Primary inbox focus: Don't count Promotions as equivalent visibility.
Trend monitoring: Look for drift, not just snapshots.
The Four Pillars of High Inbox Placement
Inbox placement improves when the fundamentals line up. The work usually falls into four buckets: authentication, reputation, engagement, and content discipline.
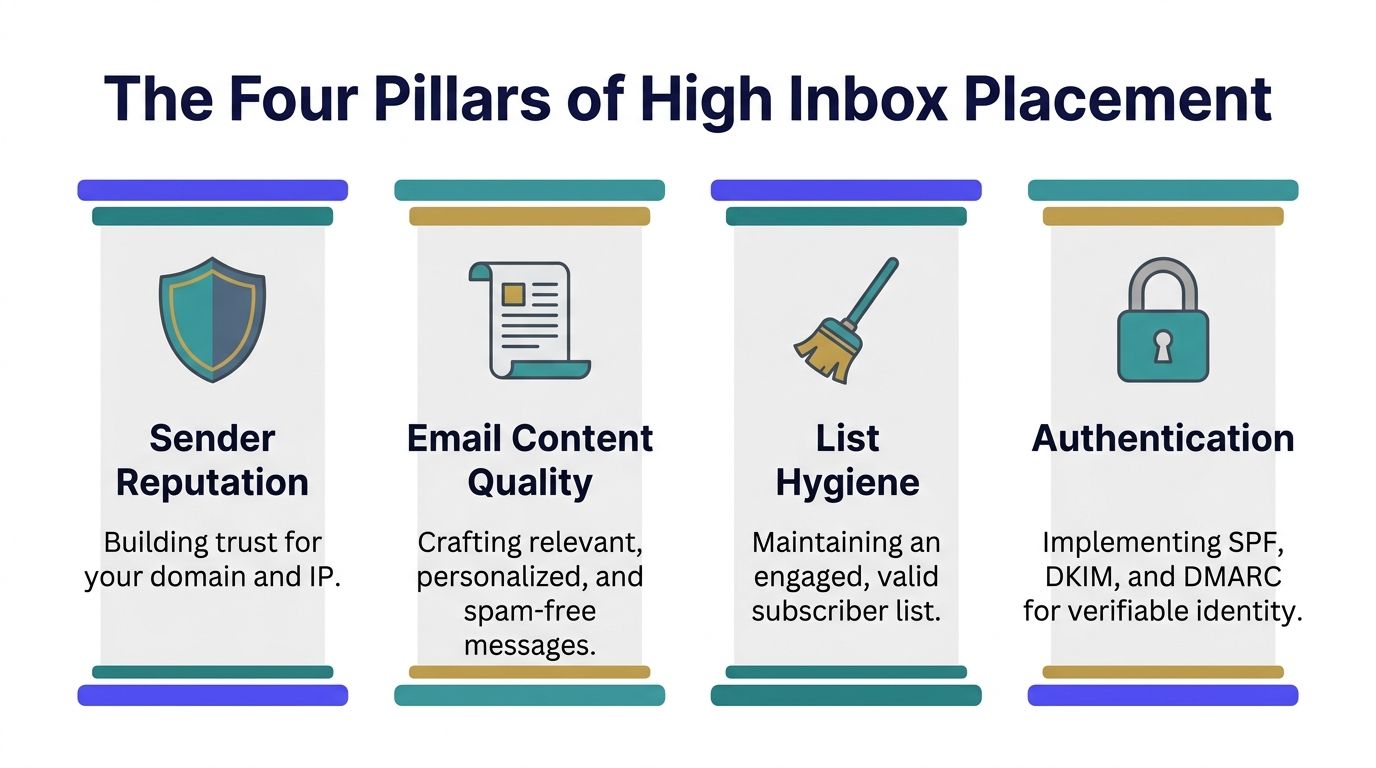
Authentication proves the sender is real
Mailbox providers want proof that the sender is who they claim to be.
According to MessageFlow's deliverability guide, the most decisive signals now include strong authentication through SPF, DKIM, and DMARC, spam complaint rates below 0.1%, bounce rates below 2%, and positive engagement signals like replies.
For teams that want a practical outside explanation of setup logic, this walkthrough on email authentication for personalized campaigns is a useful reference.
Reputation determines how much trust the sender has earned
Reputation is the long-term score mailbox providers build from behavior. It's tied to the sending domain, infrastructure, complaint patterns, bounce patterns, and recipient response.
A sender with unstable habits usually sees placement drift. That includes sudden volume spikes, poor list quality, or repeated sends to disengaged contacts.
Useful checks include:
Complaint control: Keep complaint pressure low.
Bounce prevention: Remove invalid addresses early.
Consistency: Increase volume gradually, not abruptly.
Engagement tells providers whether recipients value the email
Many teams often underestimate this problem. Mailbox providers don't just inspect the sender. They also watch what recipients do.
Signals that tend to help include:
Replies: They're among the strongest positive signals.
Threads and ongoing interaction: They suggest a real relationship.
Spam removal and important marking: They reinforce legitimacy.
A technically correct email can still underperform if recipients ignore it.
Content quality supports the other three pillars
Content alone won't rescue a weak sender reputation, but weak content can absolutely make a good setup worse.
The goal isn't to “beat filters” with tricks. The goal is to send mail that matches recipient intent, reads like human communication, and doesn't trigger avoidable suspicion.
A practical checklist helps:
Keep relevance high: Send to people who should receive the message.
Keep formatting clean: Overdesigned or noisy messages often work against trust.
Keep segmentation tight: Don't send the same message to active and stale contacts.
For a practical checklist on reducing filtering risk, Mailwarm's guide on how to avoid the spam folder is useful reading.
Your Playbook to Monitor and Improve Inbox Placement
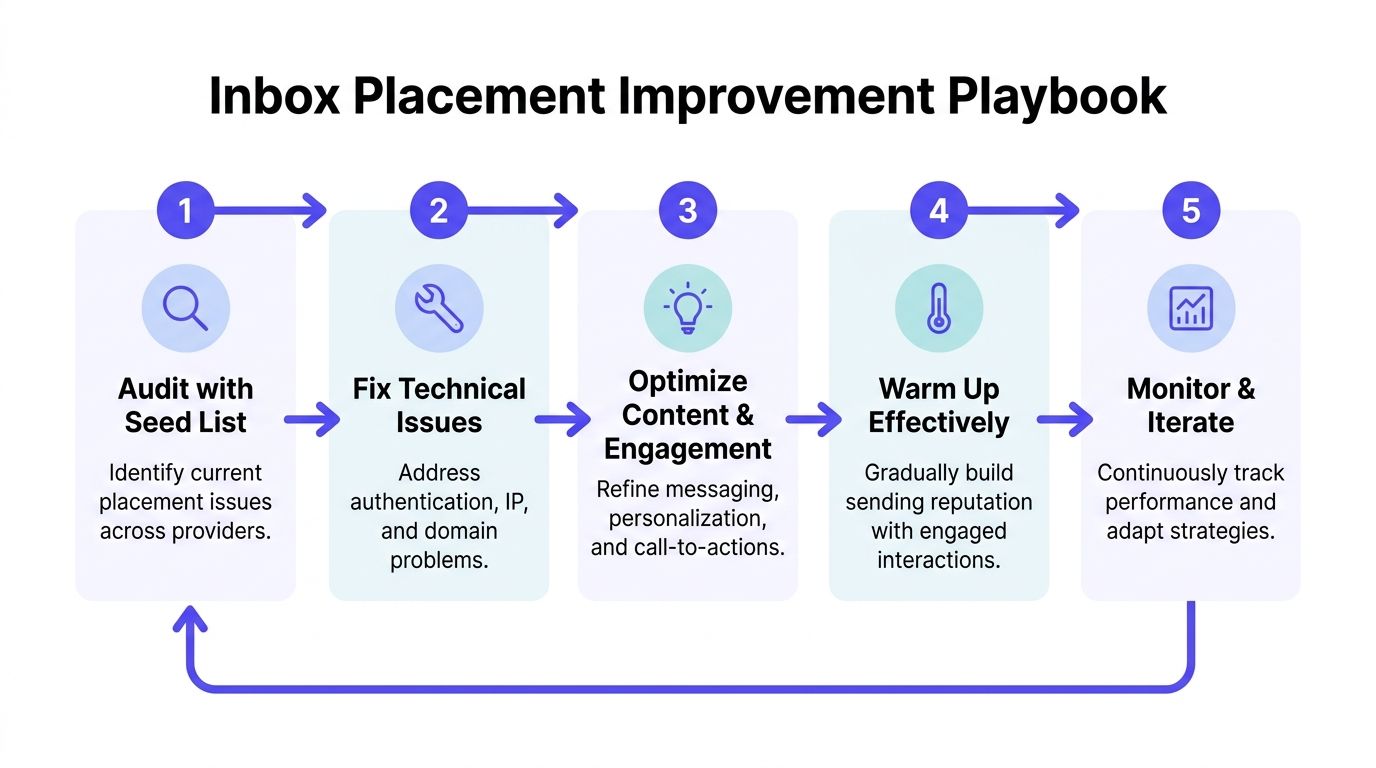
Inbox placement doesn't improve by guessing. It improves through measurement, cleanup, gradual reputation building, and ongoing review.
A practical workflow starts with visibility.
Step 1: Test placement before changing anything
According to Litmus, measuring inbox placement rate effectively requires a seed list of test addresses across major providers like Gmail and Outlook. That helps detect reputation drift, where a sender might see 95% placement at Yahoo but only 60% at Outlook because filtering algorithms differ by provider.
That kind of test is often the fastest way to stop arguing with misleading dashboard metrics. For teams that want a quick external check, MailGenius offers a free inbox placement test.
Step 2: Fix the technical layer
If authentication is misaligned or incomplete, everything else becomes harder. Before touching copy, review the sending setup, return-path alignment, and reputation basics.
The goal here is simple:
Confirm authentication is working
Review bounce and complaint patterns
Separate sending streams when needed
Stop sending to clearly stale or risky segments
Step 3: Warm up with realistic engagement
New domains, newly activated mailboxes, and underused senders usually need a gradual trust-building phase. That's where a lot of teams make the wrong trade-off and rely on shallow automation.
Mailwarm helps senders build reputation, monitor inbox placement, and improve deliverability through real inbox engagement, advanced warmup controls, and expert guidance. It uses 50,000+ aged real inboxes, supports provider-level warmup, tracks spam score and placement signals, offers custom content warmup, includes authentication fix tools and bounce prevention, and doesn't require IMAP access or permission to read a user's private inbox. Expert deliverability calls are included in every plan.
The key idea isn't “more warmup activity.” It's better trust signals.
Field note: Warmup works when it resembles healthy inbox behavior, not when it looks like synthetic traffic.
Step 4: Improve the message and the audience
If placement is unstable, the audience often needs as much work as the copy.
Good habits include:
Trim cold segments: Don't keep mailing people who never engage.
Match the message to the segment: Generic outreach creates weak interaction signals.
Ask for simple engagement: Replies matter more than vanity activity.
A useful training resource on this topic is included below.
Step 5: Monitor by provider and keep adjusting
Inbox placement isn't static. Sender reputation shifts over time, especially after changes in volume, targeting, or list quality.
A practical monitoring routine should track:
Provider-level results
Primary vs secondary tab behavior
Spam complaints
Bounce trends
Engagement quality, especially replies
Teams that review this weekly catch problems much earlier than teams that wait for a campaign collapse.
Why Basic Warmup Fails to Improve Real Inbox Placement
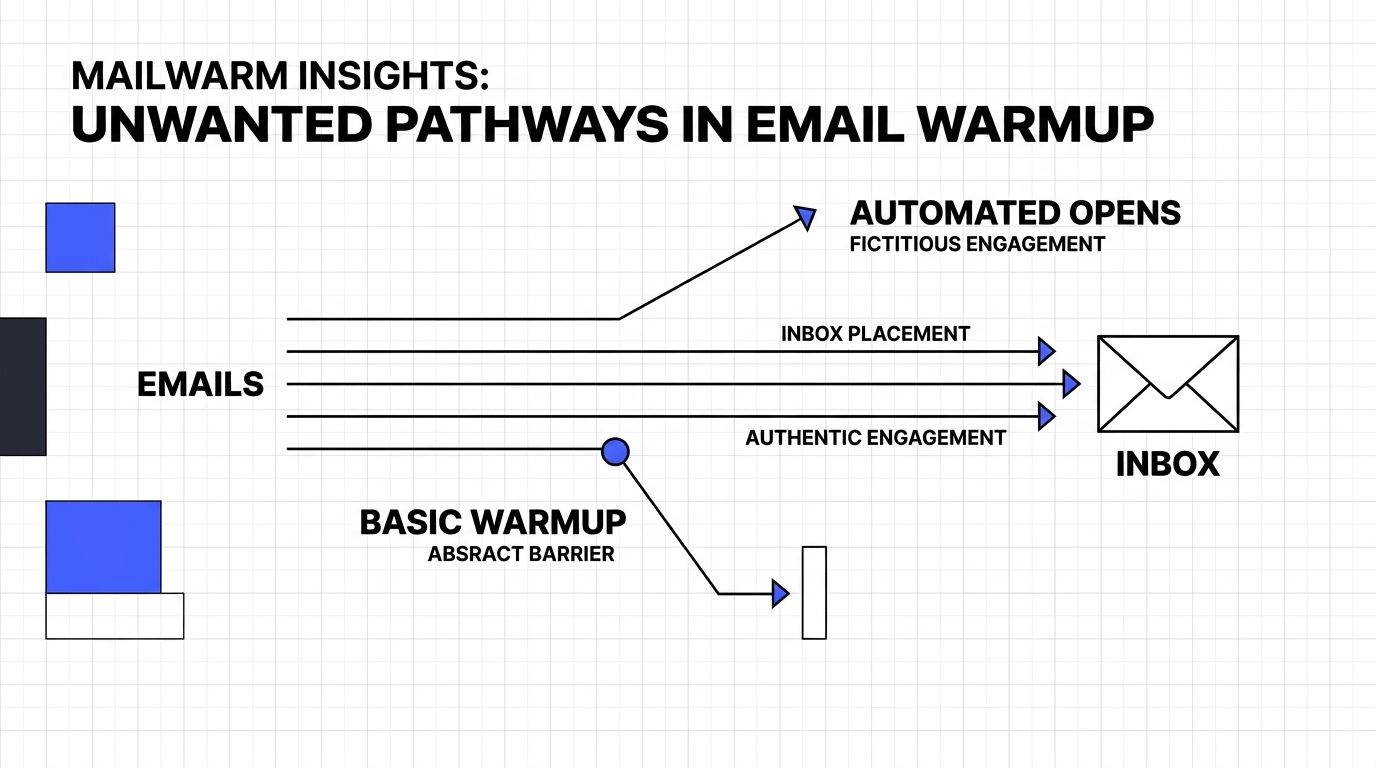
Basic warmup often focuses on easy signals. The problem is that mailbox providers care more about believable signals.
The Promotions tab is not the same as the primary inbox
A lot of warmup discussions flatten the outcome into “inbox vs spam.” That's too simplistic for businesses that need replies, meetings, and real action.
According to BulkEmailChecker, 30-40% of delivered cold emails land in the Promotions tab, and that can reduce reply rates by half despite technically good inbox placement. The same source notes that real engagement, especially replies, is the top factor for achieving Primary placement.
That changes what “success” means. If a campaign reaches Promotions instead of Primary, it may be technically delivered and still commercially weak.
Why automated activity alone falls short
Many basic tools generate activity that looks repetitive or thin. Opens without meaningful interaction don't carry the same weight as replies, threads, removals from spam, or important marking.
That's why teams often see a short-lived bump and then plateau. The sender is producing motion, but not enough trust.
A better standard for evaluating any warmup system is:
Does it create realistic engagement?
Can it target specific providers where placement is weak?
Does it help detect spam risk, not just generate activity?
Does it support the path to Primary, not just away from spam?
For teams comparing approaches, Mailwarm's article on how long warmup should last is helpful because duration only matters when the engagement quality is credible.
Primary inbox placement is the business outcome. Warmup is only useful if it moves that outcome.
Frequently Asked Questions About Inbox Placement
What is inbox placement rate?
Inbox placement rate is the percentage of emails that reach the recipient's primary inbox instead of spam, junk, or secondary tabs. It's a more useful performance metric than raw delivery when visibility matters.
How is inbox placement rate calculated?
One common formula is explained by OIMetrics as IPR = (Emails in Inbox / Total Emails Sent) × 100, excluding hard bounces. Some tools instead use delivered emails as the denominator.
What is a good inbox placement rate?
Benchmarks vary, but a strong inbox placement rate is generally treated as above 85% in the primary inbox with less than 5% in spam, based on Data Innovation. High-performing programs often aim even higher.
Why do emails go to spam or Promotions?
Mailbox providers look at authentication, complaint rates, bounce rates, sender reputation, and recipient engagement. Weak trust signals, stale lists, and low-quality interaction patterns usually hurt placement.
Does warmup improve inbox placement?
It can, but only when it helps build real sender reputation. Warmup that produces realistic engagement signals tends to help more than shallow automation.
Is warmup enough to fix deliverability?
No. Warmup helps, but it can't compensate for broken authentication, poor list hygiene, high complaint rates, or irrelevant targeting. Inbox placement improves when the full sending system is healthy.
Why is Mailwarm more expensive than basic warmup tools?
Mailwarm costs more because it combines real inbox engagement, up to 100% replies to warmup emails depending on the plan, spam score monitoring, provider-level warmup, authentication tools, no IMAP access required, and expert deliverability calls included in every plan.
Does Mailwarm need access to my inbox?
No. Unlike basic warmup tools, Mailwarm doesn't require IMAP access or permission to read a user's private inbox. That makes it less intrusive while still supporting reputation-building and monitoring.
If email is part of the growth strategy, Mailwarm helps teams build sender reputation, monitor inbox placement, and reduce spam risk with expert-guided warmup.